 English
 日本語
日本語 한국어
한국어 Español
 русский
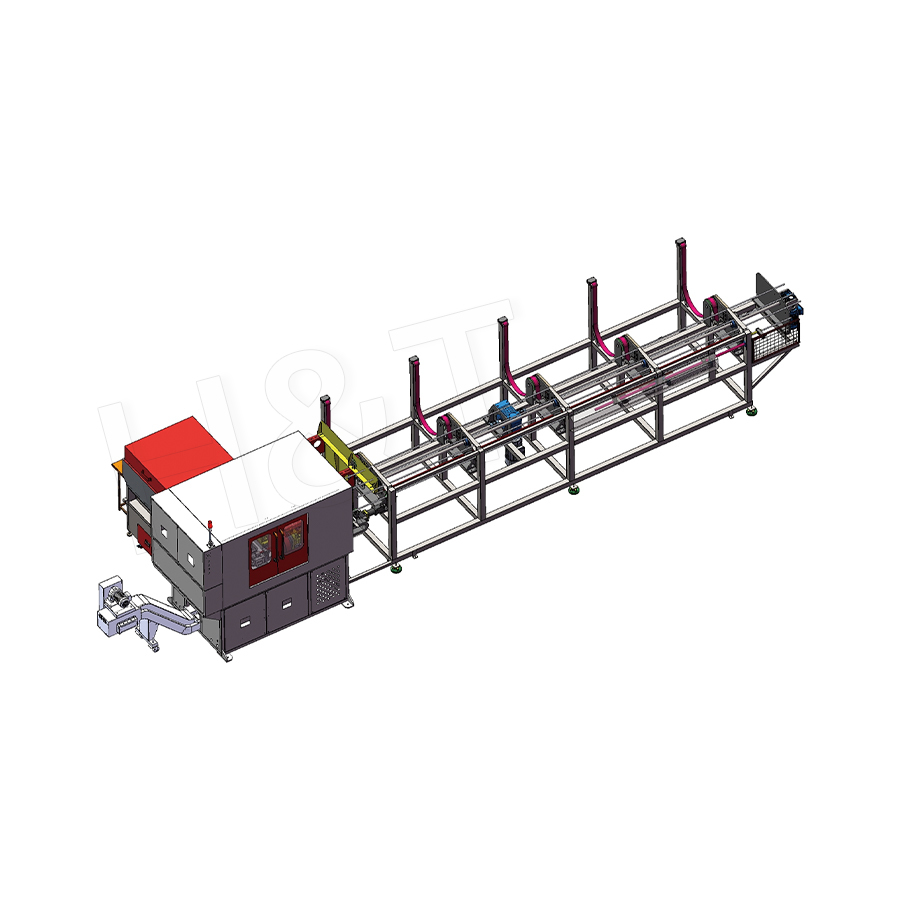
No. 196, Lifa Avenue, Haian City, Nantong, Jiangsu Province, China
News Category
Product Category
What is an Automation Line?
Content
- 1 What Is an Automation Line?
- 2 Advantages of an Automation Line
- 2.1 Higher and More Consistent Throughput
- 2.2 Consistent Product Quality Regardless of Shift or Season
- 2.3 Continuous Operation — 24 Hours a Day, 7 Days a Week
- 2.4 Lower Per-Unit Labor Cost at Scale
- 2.5 Reduced Scrap, Rework, and Warranty Cost
- 2.6 Real-Time Data for Continuous Improvement
- 2.7 Improved Worker Safety
- 3 Automation Line vs. Manual Production
- 4 How an Automation Line Improves Efficiency
- 4.1 Mechanism 1 — Synchronized Takt Time Eliminates Bottleneck Waiting
- 4.2 Mechanism 2 — Elimination of Setup and Changeover Idle Time
- 4.3 Mechanism 3 — Inline Quality Control Eliminates End-of-Line Inspection Delay
- 4.4 Mechanism 4 — Predictive Maintenance Minimizes Unplanned Downtime
- 4.5 Mechanism 5 — Material Flow Optimization Reduces Work-in-Progress
- 4.6 Mechanism 6 — Energy Efficiency at the Station Level
- 4.7 OEE: The Composite Measure of All Efficiency Gains
- 5 How to Choose the Right Automation Line
- 5.1 Step 1 — Quantify Your Production Volume and Stability
- 5.2 Step 2 — Assess Product Variety and Expected Design Changes
- 5.3 Step 3 — Map Your Process Complexity and Identify Automation-Ready Operations
- 5.4 Step 4 — Define Your Quality and Traceability Requirements
- 5.5 Step 5 — Calculate Total Cost of Ownership, Not Just Purchase Price
- 5.6 Step 6 — Evaluate Supplier Capability Beyond the Machine Specification
- 5.7 Decision Summary Checklist
What Is an Automation Line?
An automation line is a continuous production system in which mechanical equipment and electronic control devices are arranged in sequential process order and linked by a central control system — enabling full production from raw material input to finished product output with minimal or no manual intervention. It is the foundational infrastructure of modern high-volume manufacturing, replacing fragmented, labor-dependent processes with an integrated, self-regulating production flow.
Automation lines are deployed across automotive assembly, electronics manufacturing, food processing, pharmaceutical packaging, metal fabrication, and many other industries wherever consistent output quality and high throughput must coexist.
Core Definition: What Makes a Line "Automated"
A production line becomes an automation line when three conditions are met simultaneously:
- Continuous material flow: workpieces or products move automatically from one station to the next without manual transfer, using conveyors, robotic arms, or indexing mechanisms.
- Automated processing at each station: machines perform assigned operations — cutting, welding, assembling, testing, labeling — without operator action at each cycle.
- Centralized control and feedback: a control system (PLC, DCS, or industrial PC) coordinates all stations, monitors process parameters in real time, and adjusts or halts operations when deviations occur.
A line that automates only material transfer but still relies on operators for processing at each station is a semi-automated line. A fully automated line removes the operator from the production cycle entirely, retaining human roles for programming, maintenance, and quality oversight.
The Three Functional Subsystems of an Automation Line
Automated Conveyor and Transfer System
The conveyor system connects all processing stations into a single continuous flow. Common configurations include belt conveyors for lightweight products, roller conveyors for palletized loads, overhead power-and-free systems for automotive body assembly, and robotic transfer systems for high-precision or delicate components. The transfer system sets the line's takt time — the pace at which each station must complete its operation to keep the line balanced.
Automated Processing Equipment
Processing stations perform the value-adding operations: CNC machining centers, robotic welding cells, automated assembly presses, filling and sealing machines, vision-guided pick-and-place units, and laser marking or cutting stations. Each is designed to complete its operation within the takt time and to hand off a consistent, repeatable output to the next station.
Automated Inspection and Quality Control System
Inline quality systems — machine-vision cameras, laser profilometers, coordinate measurement sensors, electrical test fixtures, and X-ray or ultrasound inspection modules — check every part or a statistically defined sample at critical process steps. Defective parts are automatically diverted to a reject lane; process data is logged for traceability and statistical process control (SPC). This eliminates the end-of-line inspection bottleneck common in manual production.
Types of Automation Lines by Configuration
| Line Type | Key Characteristic | Typical Application |
|---|---|---|
| Fixed (dedicated) automation line | Optimized for one product; highest throughput | Engine block machining, beverage bottling |
| Flexible automation line | Handles multiple product variants via program change | Mixed-model vehicle assembly, electronics PCB |
| Reconfigurable automation line | Modular stations rearranged for new products | Consumer electronics, appliance manufacturing |
| Semi-automated line | Automated transfer; operator-assisted processing | Low-volume precision assembly, prototyping |
The Control Architecture: How the Line Thinks
Modern automation lines use a hierarchical control architecture:
- Field level: sensors, actuators, servo drives, and vision cameras collect real-time data from each station.
- Control level: PLCs or distributed control systems (DCS) execute machine logic and safety interlocks at each station, communicating over industrial networks (EtherCAT, PROFINET, or DeviceNet).
- Supervisory level: SCADA or MES software provides real-time dashboards, production scheduling, downtime tracking, and quality data aggregation across the entire line.
- Enterprise level: ERP integration feeds production actuals to business systems for inventory, billing, and supply chain management.
This layered architecture gives an automation line both the millisecond-level responsiveness needed at machine level and the business-level visibility needed for production planning — making it a fundamentally different system from a collection of standalone machines.
Industries Where Automation Lines Are Essential
- Automotive: body-in-white welding lines, powertrain machining lines, and final assembly lines that produce one vehicle every 60–90 seconds in high-volume plants.
- Electronics: SMT (surface mount technology) lines that place and solder thousands of components per hour on PCBs with micron-level precision.
- Pharmaceuticals: filling, capping, labeling, and serialization lines operating in cleanroom conditions where human contact must be minimized.
- Food and beverage: filling lines processing up to 120,000 bottles per hour with integrated weight checks and seal inspection.
- Metal fabrication: stamping, laser cutting, bending, and welding lines converting coil steel to finished structural components with no manual handling between stations.

Advantages of an Automation Line
The primary advantages of an automation line are dramatically higher throughput, consistent product quality independent of operator skill, continuous 24/7 operation capability, lower per-unit labor cost, reduced scrap and rework, and real-time production data for process optimization. These advantages compound over time: a well-implemented automation line typically achieves payback within two to four years and then generates cost savings for the remainder of its 10–15 year service life.
Higher and More Consistent Throughput
An automation line operates at a defined takt time — the cycle time of the slowest station — without the variability that human operators introduce. A manual assembly line might achieve 70–80% of theoretical cycle time due to fatigue, breaks, and skill variation. An automated equivalent typically sustains 90–95% of theoretical throughput during scheduled production time.
In a beverage filling plant, a manual filling line might produce 8,000–10,000 units per hour. An automated filling and packaging line at the same footprint routinely achieves 30,000–50,000 units per hour — a three- to five-fold increase — while using fewer operators.
Consistent Product Quality Regardless of Shift or Season
Manual processes introduce quality variation tied to operator experience, fatigue after hour six of a shift, and turnover that disrupts accumulated skill. Automation applies exactly the same force, temperature, speed, and positioning on the ten-thousandth part as on the first.
In precision electronics assembly, robotic pick-and-place systems achieve component placement accuracy of ±0.025 mm — a tolerance physically impossible to sustain manually over thousands of placements per hour. Process capability indices (Cpk) of ≥ 1.67 are standard on well-configured automated lines, compared to 0.8–1.0 typically achieved in manual operations.
Continuous Operation — 24 Hours a Day, 7 Days a Week
Automation lines do not require sleep, meal breaks, or shift handovers that stall output. With proper preventive maintenance scheduling, a fully automated line can run 6,000–7,500 hours per year versus approximately 4,000–4,500 hours per year for a two-shift manual operation. That additional production time — without additional labor cost — fundamentally changes the economics of capital investment.
Lights-out overnight operation, common in CNC machining and electronics testing, allows one supervisor to monitor multiple lines remotely, producing finished goods that are ready for dispatch at the start of the next business day.
Lower Per-Unit Labor Cost at Scale
The automation line's capital cost is fixed regardless of output volume. As annual production volume increases, the fixed capital cost is spread across more units, driving the per-unit cost down continuously. Labor cost, by contrast, scales roughly linearly with output on a manual line.
| Annual Volume | Manual Line: Labor Cost/Unit | Automation Line: Total Cost/Unit | Automation Saving |
|---|---|---|---|
| 50,000 units | $4.20 | $5.80 (high capital, low volume) | — |
| 200,000 units | $4.20 | $2.60 | 38% |
| 500,000 units | $4.20 | $1.40 | 67% |
The break-even point — where automation's per-unit total cost falls below the manual line's — typically occurs between 100,000 and 300,000 units per year for medium-complexity parts, depending on product value and automation capital cost.
Reduced Scrap, Rework, and Warranty Cost
Inline automated inspection catches defects at the point of creation — before they are built into the next assembly step and compounded. In automotive wiring harness production, introducing automated vision inspection at the crimp station reduced field warranty claims related to poor crimps by over 80% within 18 months of deployment.
Across manufacturing sectors, automation lines typically achieve scrap rates of 0.1–0.5% versus 2–8% for equivalent manual operations. On high-value products, the material cost saved from reduced scrap alone can justify a significant portion of the automation investment.
Real-Time Data for Continuous Improvement
An automation line generates a continuous stream of production data — cycle times, reject codes, machine availability, energy consumption, and process parameters — that is simply unavailable in manual production. This data enables:
- OEE (Overall Equipment Effectiveness) tracking to identify the biggest sources of production loss.
- Predictive maintenance based on vibration, temperature, and cycle-count data, reducing unplanned downtime by 30–50% compared to time-based maintenance schedules.
- Statistical process control (SPC) that detects process drift and triggers corrective action before parts go out of tolerance.
- Full part traceability from raw material batch to finished product serial number — increasingly required by automotive, medical, and aerospace customers.
Improved Worker Safety
Automation removes operators from hazardous tasks: heavy lifting, repetitive motion that causes musculoskeletal injury, exposure to welding fumes, chemical vapors, extreme heat, or high-noise environments. In foundry and stamping operations, fully automating material handling has reduced workplace injury rates by 60–90% compared to manual equivalents.
Beyond the human benefit, reduced injury rates lower insurance premiums, eliminate lost-time incident costs, and reduce regulatory compliance burden — all of which contribute to the business case for automation.

Automation Line vs. Manual Production
Automation lines are better than manual production for high-volume, repetitive, precision-sensitive work — delivering higher output, lower per-unit cost, and more consistent quality. Manual production remains preferable for low volumes, highly variable products, tasks requiring human dexterity and judgment, or operations where the capital investment in automation cannot be justified by production economics.
The honest answer is that neither is universally superior. The decision should be driven by data: annual volume, product variety, quality tolerance, and total cost of ownership over a realistic investment horizon.
Head-to-Head Comparison Across Key Dimensions
| Criterion | Manual Production | Automation Line |
|---|---|---|
| Throughput consistency | 70 – 80% of theoretical rate | 90 – 95% of theoretical rate |
| Quality consistency (Cpk) | 0.8 – 1.0 | 1.33 – 1.67 |
| Scrap rate | 2 – 8% | 0.1 – 0.5% |
| Operating hours per year | 3,500 – 4,500 (two shifts) | 6,000 – 7,500 (near-continuous) |
| Capital investment | Low | High |
| Flexibility for new products | High (retrain operators) | Moderate to low (reprogramming / retooling) |
| Minimum viable volume | Any volume | Typically > 100,000 units/year |
| Response to product variety | Excellent (human adaptability) | Limited without flexible design |
| Safety risk exposure | Higher (repetitive strain, hazardous tasks) | Lower |
Where Automation Lines Clearly Win
High-Volume Repetitive Production
When the same product or product family is produced in large quantities — hundreds of thousands or millions of units per year — automation's fixed capital cost is spread so thinly across output that per-unit cost becomes dramatically lower than manual. An automotive stamping plant producing 2 million body panels per year simply cannot be economically operated manually; the labor cost would be prohibitive and quality consistency unachievable.
Precision Beyond Human Capability
Some operations exceed what any human can reliably perform at production speed. Robotic welding maintains torch position to ±0.1 mm on every pass. Automated vision systems inspect 100% of parts at 1,200 units per minute for defects invisible to the human eye at that speed. No amount of operator training replicates this consistently.
Hazardous or Ergonomically Damaging Environments
Welding, casting, chemical processing, and heavy press operations expose workers to genuine physical risk. Automating these stations eliminates the hazard at its source rather than managing it through personal protective equipment, shift limits, and injury surveillance.
Where Manual Production Remains Superior
Low Volumes and High Product Variety
A custom furniture workshop producing 500 unique pieces per year, a bespoke electronics repair shop, or a prototype manufacturing cell cannot justify automation investment that might take 20 years to pay back. Human operators can switch between completely different tasks within minutes, whereas reconfiguring a dedicated automation line takes days and significant engineering cost.
Tasks Requiring Adaptive Judgment
Final assembly of complex systems where component variation, fit issues, or configuration changes arise unpredictably still benefits from human judgment. Aircraft interior fitting, high-end watchmaking, and complex surgical instrument assembly all retain significant human labor for operations where machine vision and robotic dexterity cannot yet match human adaptability at competitive cost.
Early-Stage Products Still in Design Flux
Investing in automation before a product design is stable risks building dedicated tooling and fixtures that become obsolete when the design changes — a costly mistake common in technology companies that automate too early. Manual production during the product development phase preserves flexibility and avoids premature capital commitment.
The Hybrid Reality: Most Modern Lines Combine Both
The majority of real production environments use a combination: automated processes for high-volume, precision, or hazardous operations alongside human workers for adaptive tasks, final inspection, exception handling, and changeover management. This hybrid model — sometimes called collaborative automation — captures most of the productivity and quality benefits of automation while retaining the flexibility that pure automation cannot provide. The practical question is not "automate or not" but "which stations to automate first, and to what level."
How an Automation Line Improves Efficiency
An automation line improves efficiency by eliminating the three primary sources of production loss — unplanned downtime, process variability, and non-value-adding wait time — through synchronized machine control, inline quality monitoring, and continuous material flow that keeps every station productive simultaneously. The cumulative effect typically raises Overall Equipment Effectiveness (OEE) from the 40–60% common in manual operations to 75–90% on well-run automated lines.
Mechanism 1 — Synchronized Takt Time Eliminates Bottleneck Waiting
In a manual production line, each operator works at their own pace. The fastest worker finishes early and waits; the slowest creates a queue in front of them that starves all downstream stations. The line's output is limited by the slowest person — and that person's speed varies by hour and by day.
An automation line imposes a single takt time on all stations. The conveyor indexes every station simultaneously; no station can fall behind. The line's output equals the takt time times the number of operating hours — a predictable, stable rate that manual lines simply cannot match. In a consumer electronics assembly study, replacing a 20-person manual line with an automated equivalent at the same takt time reduced total production time per unit by 34% by eliminating inter-station waiting.
Mechanism 2 — Elimination of Setup and Changeover Idle Time
Manual production lines lose significant time to shift changeovers, tool changes, and setup verification. A flexible automation line stores multiple product programs in its control system. Switching from one product variant to another involves:
- Calling the new program from the central server — typically under 60 seconds.
- Automatic tool or fixture change where required — typically 2–8 minutes on a robotic cell versus 20–60 minutes manually.
- Automatic parameter verification via sensor feedback — no trial runs needed.
For a plant running ten different product variants per shift, reducing average changeover time from 45 minutes to 5 minutes recovers 400 minutes of productive time per shift — equivalent to adding nearly a full additional shift of output.
Mechanism 3 — Inline Quality Control Eliminates End-of-Line Inspection Delay
Manual production typically batches finished goods and sends them to a separate inspection area, creating a time lag between defect creation and detection. If a process drifts out of specification at 9 AM and the batch isn't inspected until 3 PM, six hours of defective output must be reworked or scrapped.
Automation lines integrate inspection at each process step. A vision system on a welding robot checks every weld bead for width, continuity, and position within the same cycle that produces the weld. If a defect is detected, the system stops the line and alerts maintenance before the next unit is produced — limiting defective output to one part, not one batch. This alone reduces rework labor by 30–60% in typical metalworking and electronics applications.
Mechanism 4 — Predictive Maintenance Minimizes Unplanned Downtime
Unplanned machine downtime is the single largest efficiency killer in manufacturing. Industry surveys consistently show that unplanned downtime costs manufacturers an average of $260,000 per hour in lost production across sectors — and that most facilities experience 800+ hours of unplanned downtime per year.
Automation line control systems collect real-time data from vibration sensors, temperature monitors, current draw meters, and cycle-count registers on every actuator, motor, and bearing in the line. Machine-learning algorithms trained on historical failure data identify patterns that precede failures — abnormal vibration frequency, rising bearing temperature, increasing servo current draw — and trigger maintenance alerts days or weeks before a failure occurs.
Facilities that have implemented predictive maintenance on automation lines report reductions in unplanned downtime of 30–50% and maintenance labor cost reductions of 10–25% by shifting work from reactive emergency repair to scheduled preventive replacement.
Mechanism 5 — Material Flow Optimization Reduces Work-in-Progress
In manual production, work-in-progress (WIP) accumulates between stations as operators work at different speeds and batch sizes vary. Large WIP buffers tie up capital in unfinished inventory, extend lead times, and make quality escapes harder to trace.
An automation line operating at a defined takt time with conveyor-controlled spacing limits inter-station WIP to a small, deliberate buffer — typically one to three pieces between each station. This reduces total WIP inventory by 40–70% compared to manual batch production, shortens average lead time from raw material to finished goods, and makes quality traceability straightforward because every part's location and processing history is known at all times.
Mechanism 6 — Energy Efficiency at the Station Level
Servo-driven automation systems consume energy only when performing work. Servo motors on modern automation lines incorporate energy recovery during deceleration — returning kinetic energy to the bus rather than dissipating it as heat. Station-level power management shuts down actuators, lighting, and HVAC in idle zones automatically.
Compared to the equivalent manual operation with its associated facility load (lighting, climate control for operator comfort, compressed air wastage from manual tools), a servo-driven automation line typically reduces energy consumption per unit produced by 15–30% at equivalent output volumes.
OEE: The Composite Measure of All Efficiency Gains
Overall Equipment Effectiveness (OEE) captures all six mechanisms in a single metric: OEE = Availability × Performance × Quality. A world-class automation line achieves:
- Availability ≥ 90% (predictive maintenance, fast changeovers)
- Performance ≥ 95% (synchronized takt time, no operator pace variation)
- Quality ≥ 99% (inline inspection, process Cpk ≥ 1.33)
- OEE ≥ 85% — versus a typical manual line OEE of 40–55%
The difference between OEE 50% and OEE 85% on the same line is equivalent to building a second production line — without the capital cost.
How to Choose the Right Automation Line
The right automation line is determined by systematically matching five parameters — annual production volume, product variety, process complexity, available capital budget, and integration requirements — to the appropriate line type, automation level, and control architecture. Choosing based on any single factor, such as lowest purchase price or highest automation level, without considering the others leads to either underperforming lines or unjustifiable capital expenditure.
The following framework provides a structured decision process applicable to most manufacturing environments.
Step 1 — Quantify Your Production Volume and Stability
Annual production volume is the single most important input to the automation decision because it determines whether capital investment can be amortized to a competitive per-unit cost.
- Under 50,000 units/year: full automation is rarely justifiable for standard products. Semi-automated lines or automated individual stations within a manual line are typically more appropriate.
- 50,000 – 300,000 units/year: the transition zone. Flexible automation lines with multi-product capability are the right fit; fixed dedicated lines should be avoided because volume alone may not justify them.
- Over 300,000 units/year (stable product): fixed or semi-fixed automation lines optimized for one product family deliver the lowest per-unit cost and highest reliability.
Critically, assess volume stability. If demand is highly seasonal or uncertain, a fixed high-capacity line will run under-utilized for significant periods, degrading the return on investment. In this case, a modular or flexible line that can be scaled up or down is preferable even if its peak efficiency is slightly lower.
Step 2 — Assess Product Variety and Expected Design Changes
The number of distinct product variants processed on the line determines the required flexibility of the automation system:
| Product Variants | Recommended Line Type | Key Requirement |
|---|---|---|
| 1 – 3 (stable design) | Fixed (dedicated) automation line | Optimized tooling, maximum throughput |
| 4 – 20 (similar families) | Flexible automation line | Fast program changeover, adjustable fixtures |
| 20+ or frequent new products | Reconfigurable or modular automation line | Modular stations, robot-based processing |
| Highly variable / custom | Semi-automated line with human assembly | Automated material handling; manual processing |
Also consider the product lifecycle. If the product is in active development and design changes occur every 6–12 months, avoid investing in dedicated hard tooling that becomes obsolete with each revision. Robot-based flexible systems with reconfigurable end-of-arm tooling are more future-proof in this scenario.
Step 3 — Map Your Process Complexity and Identify Automation-Ready Operations
Not all operations in a production sequence are equally automatable. Before specifying a full automation line, conduct a process-by-process analysis:
- High automation suitability: operations that are repetitive, physically defined, and measurable — welding, stamping, filling, labeling, testing, palletizing, CNC machining.
- Medium automation suitability: operations requiring sensor feedback and some adaptive logic — assembly of parts with dimensional variation, visual inspection of complex surfaces.
- Low automation suitability (currently): operations requiring fine motor skill, judgment under ambiguity, or frequent unplanned variation — final fit-and-finish on complex assemblies, complex cable routing, bespoke adjustments.
Start automation at the highest-suitability operations and leave the low-suitability ones to human operators. This phased approach achieves most of the efficiency gains at a fraction of the cost of attempting to automate everything simultaneously.
Step 4 — Define Your Quality and Traceability Requirements
Quality requirements directly influence the specification of the inspection subsystem and the control architecture of the line. Ask the following questions before finalizing the specification:
- What dimensional tolerances must the finished product meet, and at what inspection frequency — 100% or statistical sampling?
- Are customers or regulators (automotive OEMs, FDA, aerospace authorities) requiring full part traceability from raw material batch to shipped unit?
- What is the maximum acceptable field failure rate, and what does a single warranty claim cost versus the cost of 100% inline inspection?
If full traceability is required, specify a line with integrated barcode or RFID tracking at every station and a manufacturing execution system (MES) that logs process parameters against each part serial number. This adds cost but is non-negotiable for medical device, aerospace, and automotive safety-critical components.
Step 5 — Calculate Total Cost of Ownership, Not Just Purchase Price
The purchase price of an automation line is typically 30–50% of its 10-year total cost of ownership (TCO). The remaining costs include:
- Installation and commissioning: typically 10–20% of machine purchase cost, including civil works, electrical supply, and compressed air infrastructure.
- Energy: a medium-complexity automation line with servo drives, robots, and HVAC may consume 80–200 kW. At 6,000 operating hours per year, energy cost is a significant operating line item.
- Consumables and tooling: robot wear parts, gripper replacements, vision system calibration targets, and fixture wear components — budget 3–6% of capital cost per year.
- Maintenance labor: automation lines require skilled maintenance technicians with PLC, robotics, and servo system competence. Ensure this skill exists in-house or is available via service contract before committing.
- Downtime cost: calculate the production revenue lost per hour of downtime and ensure the supplier can commit to spare-parts availability and on-site service response time that keeps downtime within acceptable limits.
Step 6 — Evaluate Supplier Capability Beyond the Machine Specification
An automation line is not a product purchase — it is a long-term technical partnership. Evaluate potential suppliers on the following criteria beyond the equipment specification sheet:
- Reference installations: ask for contact with at least three existing customers running similar lines in similar production environments. Visit at least one site in operation before committing.
- Acceptance testing protocol: specify Factory Acceptance Testing (FAT) at the supplier's facility and Site Acceptance Testing (SAT) after installation, with clear performance criteria (OEE, throughput, quality rate) that must be met before final payment.
- Local service and spare-parts availability: a supplier with no local service capability will leave you dependent on expensive international travel for every emergency repair. Confirm response time commitments contractually.
- Software openness and data access: ensure you own or have perpetual access to PLC programs, robot programs, and HMI code. Locked or proprietary software creates dependency that limits your ability to make modifications or switch maintenance providers.
- Operator and maintenance training: confirm that comprehensive training for operators, maintenance technicians, and programming staff is included in the contract, not sold separately at a premium after installation.
Decision Summary Checklist
- Annual production volume confirmed → Determines whether full, flexible, or semi-automation is justified.
- Number of product variants and design stability assessed → Determines line type (fixed / flexible / reconfigurable).
- Process-by-process automation suitability rated → Identifies which stations to automate first.
- Quality and traceability requirements defined → Specifies inspection subsystem and MES integration level.
- 10-year TCO calculated and compared to manual alternative → Validates financial justification with realistic payback period.
- Supplier references verified, FAT/SAT criteria agreed, service contracts confirmed → Protects against commissioning delays and long-term support gaps.
Following this framework systematically produces an automation line specification matched to real operational needs rather than to a catalogue's maximum claims — and significantly increases the probability that the line achieves its efficiency targets within the planned investment period.
Featured Products
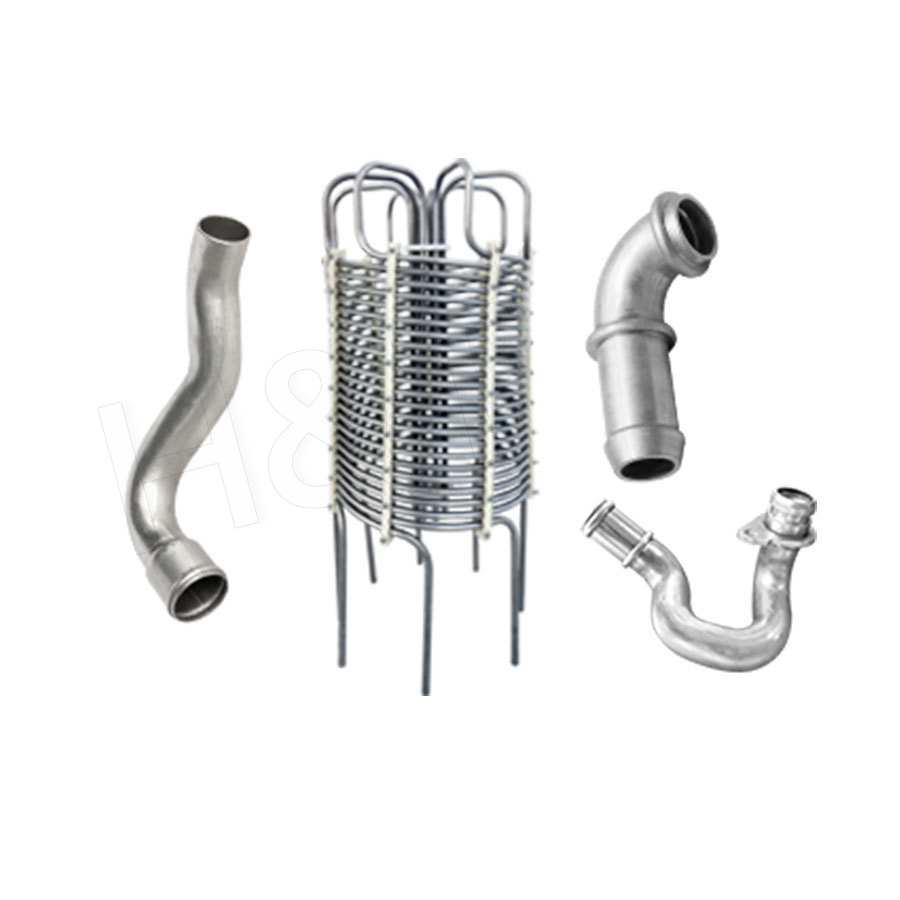
A Complete Range of Tube Processing Solutions
Precision Tube Bending
 Ready To Customise
Your Bent Tube Products?

Your Bent Tube Products?
Proprietary software, smart control systems, and 50+ patents ensure more efficient and intelligent production at every step.
Copyright © 2025 by Gipfel Precision Machinery Co.,Ltd All Rights Reserved. Precision Tube Machinery Manufacturer | Pipe Forming, Cutting, End Forming Solutions
